Table Tennis Analyzer
Turns broadcast match footage into player tracking, score charts, and heatmaps
- 2
- models (1 custom-trained)
- 3
- outputs per match: video, chart, heatmap
- 0
- manual tagging required
What it does
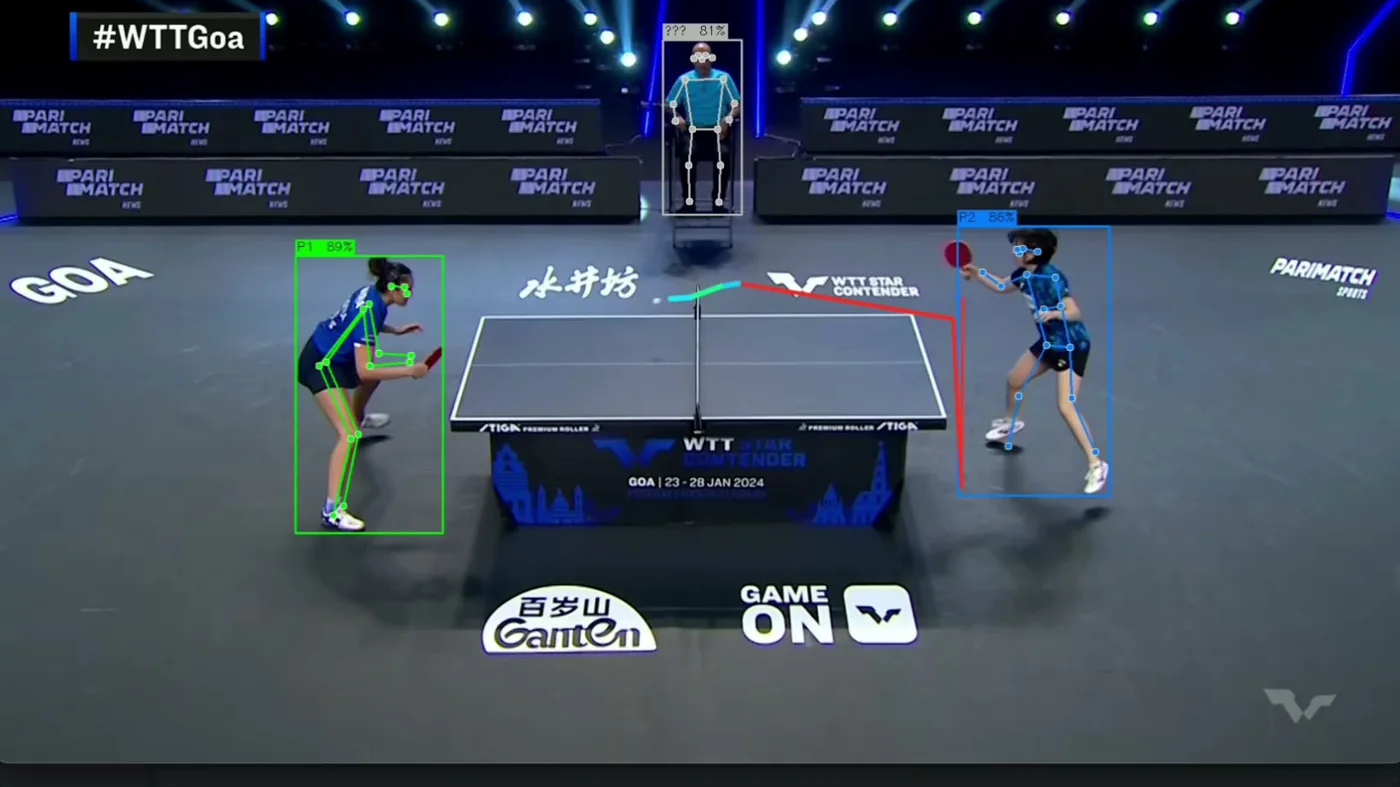
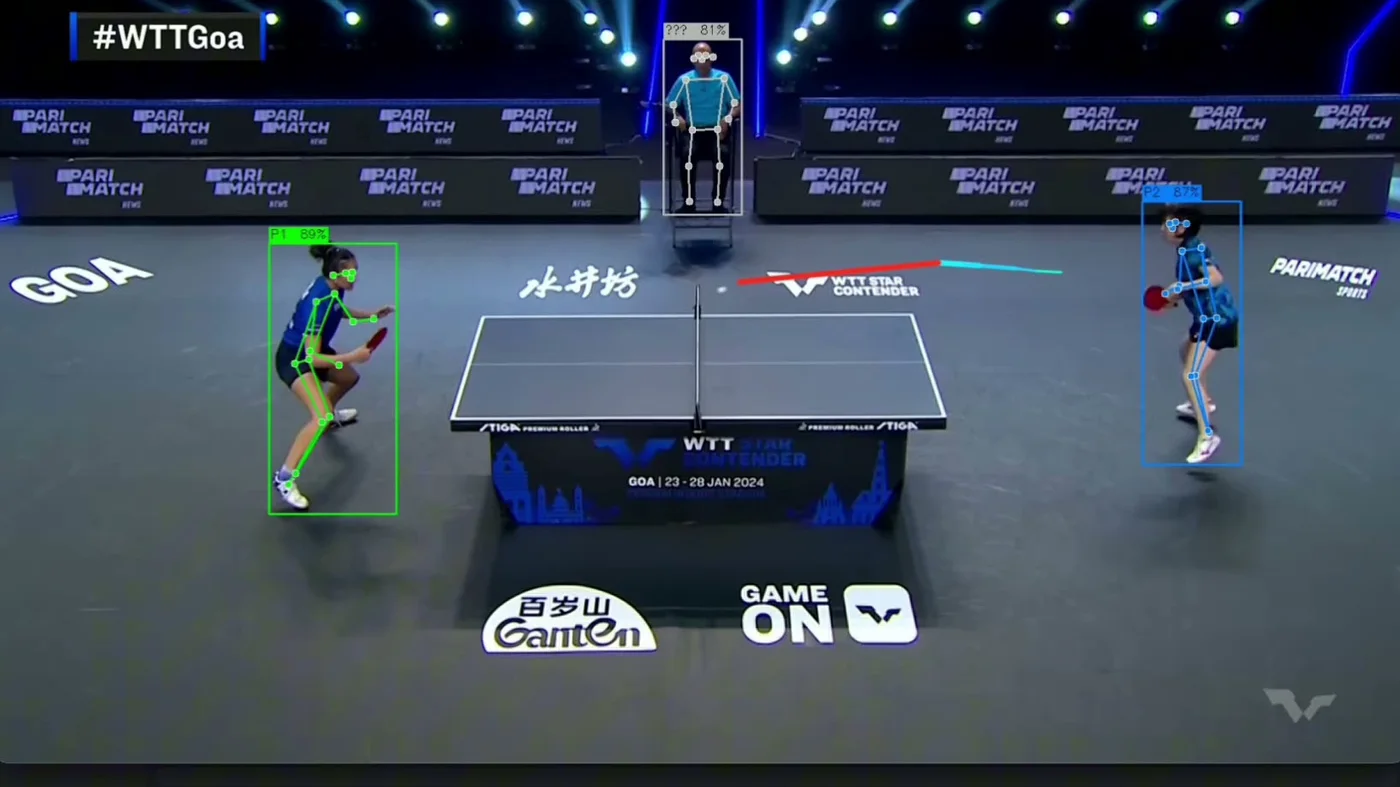
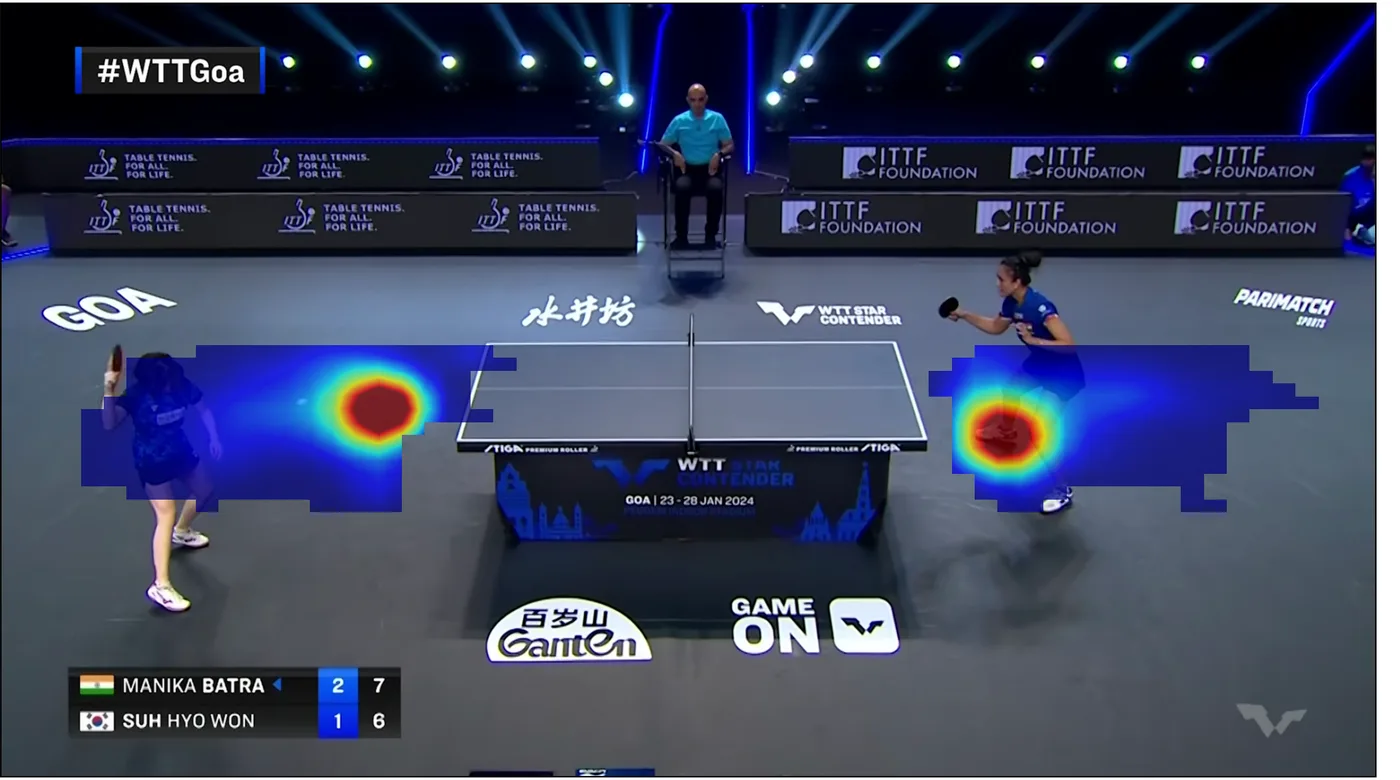
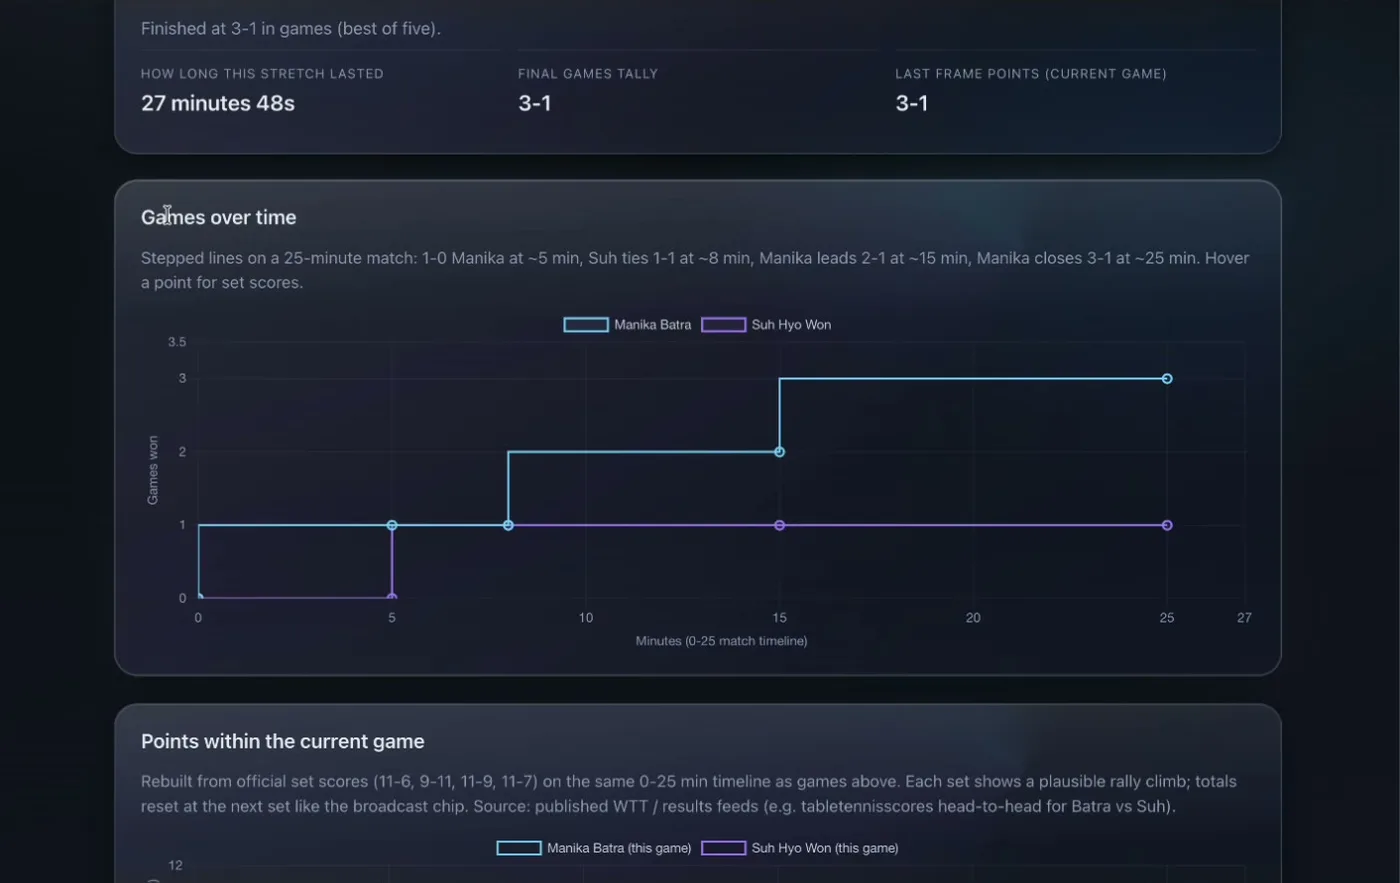
Feed it a table tennis video and it produces match analytics without anyone tagging events by hand. It tracks both players and the ball, reads the scoreboard directly off the screen, and returns an annotated replay, a score progression chart and a position heatmap. A small React page pulls those outputs together into a match recap.
How it works
Track the players
YOLOv8-pose gives full skeletons rather than boxes. The table splits the frame, so the leftmost and rightmost centroids identify the two players without needing a tracker with identity memory.
Detect the ball with a custom model
Frames are extracted from source video, labelled in Roboflow, and used to train a dedicated YOLO detector. This is the part that decides whether the whole pipeline works.
Read the scoreboard
EasyOCR runs on a cropped scoreboard region, sampled every N frames rather than every frame, and reconstructs the score over time.
Throw out the frames that lie
A validity check drops replays, crowd shots and graphics before they inject nonsense readings, and a frozen-frame detector ends the pass early instead of grinding through a static end card.
Collapse to one series
Readings become a single monotonic number, games won times ten plus points, which makes the chart trivial to plot and makes a bad OCR read obvious as a spike.
Render the outputs
Ball trails are coloured blue to yellow to red by inferred speed. A second pass goes back over the segment and cuts a 15 second clip around the fastest shot.
The shape of it
Match video
- three passes:
YOLOv8-pose
both players
Custom YOLO
the ball
EasyOCR
scoreboard, every N frames
- discard non-gameplay:
Validity filter
replays, crowd, graphics
- collapse to one series:
(games x 10) + points
monotonic, spikes = bad reads
Annotated video
skeletons, speed-coloured trail
Score chart
Position heatmap
Tech choices
The decisions that shaped it, and why they went that way.
- The ball needed a custom detector
- A table tennis ball is a handful of pixels moving fast enough to motion-blur. No off-the-shelf model finds it reliably, so building a dataset was unavoidable.
- OCR instead of rally detection
- The score is already rendered on screen every frame. Reading it is a far smaller problem than inferring points from play.
- Sampling every N frames
- A score changes a few dozen times in a match. Running OCR on all of them is almost entirely wasted compute.
- Two passes for the fastest shot
- You cannot know the maximum speed until the whole segment has been scanned, so the clip is cut on a second pass.
Built with
- Vision
- Ultralytics YOLOv8OpenCVEasyOCR
- Data
- NumPySciPyMatplotlibRoboflow
- Frontend
- ViteReactTypeScriptChart.js
What it produces
How the repo is laid out
Roughly the order you'd read it in: entry point first, then the parts doing the work.
table_tennis_analyzer.pyMain pipeline: pose, ball trail, scoreboard OCRgenerate_ball_csv.pyPer-frame ball track, despiked and gap-filledball_track_helpers.pyShared ball inference, device pick, smoothinggenerate_heatmap.pyRenders player density over a gameplay frametrain_ball_model.pyTrains the custom YOLO ball detectorextract_frames.pyPulls evenly spaced frames for labellingweb/React recap site, charts the score CSV
Where it falls short
I no longer have the trained ball detector. It was not committed and the local copy is gone, so the pipeline cannot be re-run end to end without training a new one from the labelled dataset. Everything shown here is output it produced while it existed. No automated tests either: the pipeline was validated by watching the annotated video, which catches real errors but is not a substitute for a test suite.